Custom TFT Screen for the Ecowitt Weather Station
Ditching windows for a TFT Screen and an Arduino
Date:
[]
Views: [3490]
Categories:
[projects]
Tags:
[weather],
[arduino],
[freertos]
I need to write a larger article about the nonsense I've erected up the side of my garage, The Stratofortress, but for now let's chat about the weather station that's part of it.
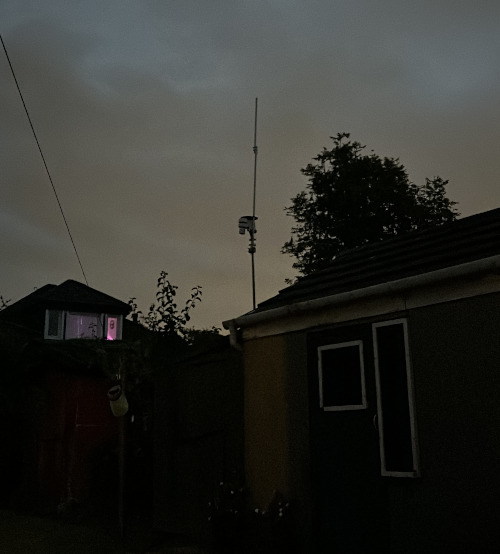
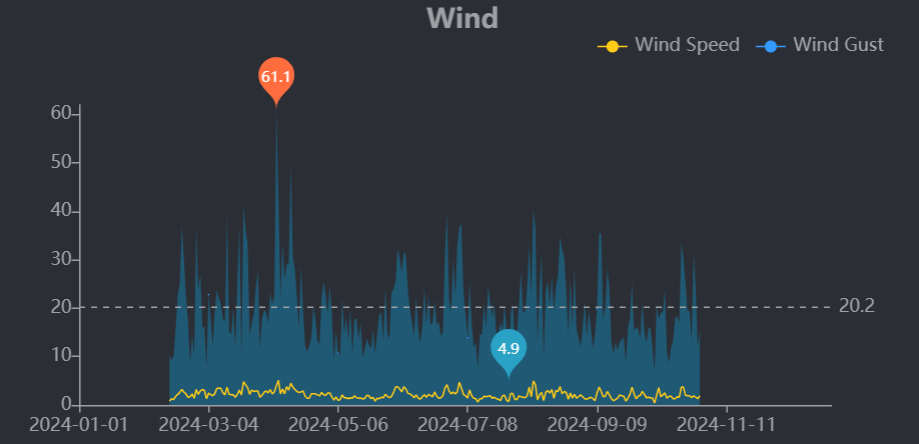
Our house sits in a funny spot. Despite being in the city, it's right on the brow of the tallest hill in the area and gets absolutely battered by the wind. How much does it get battered? Well, that's the question that had been bugging me since we moved in, so my Amazon shopping cart sat with various weather stations for a couple of years.
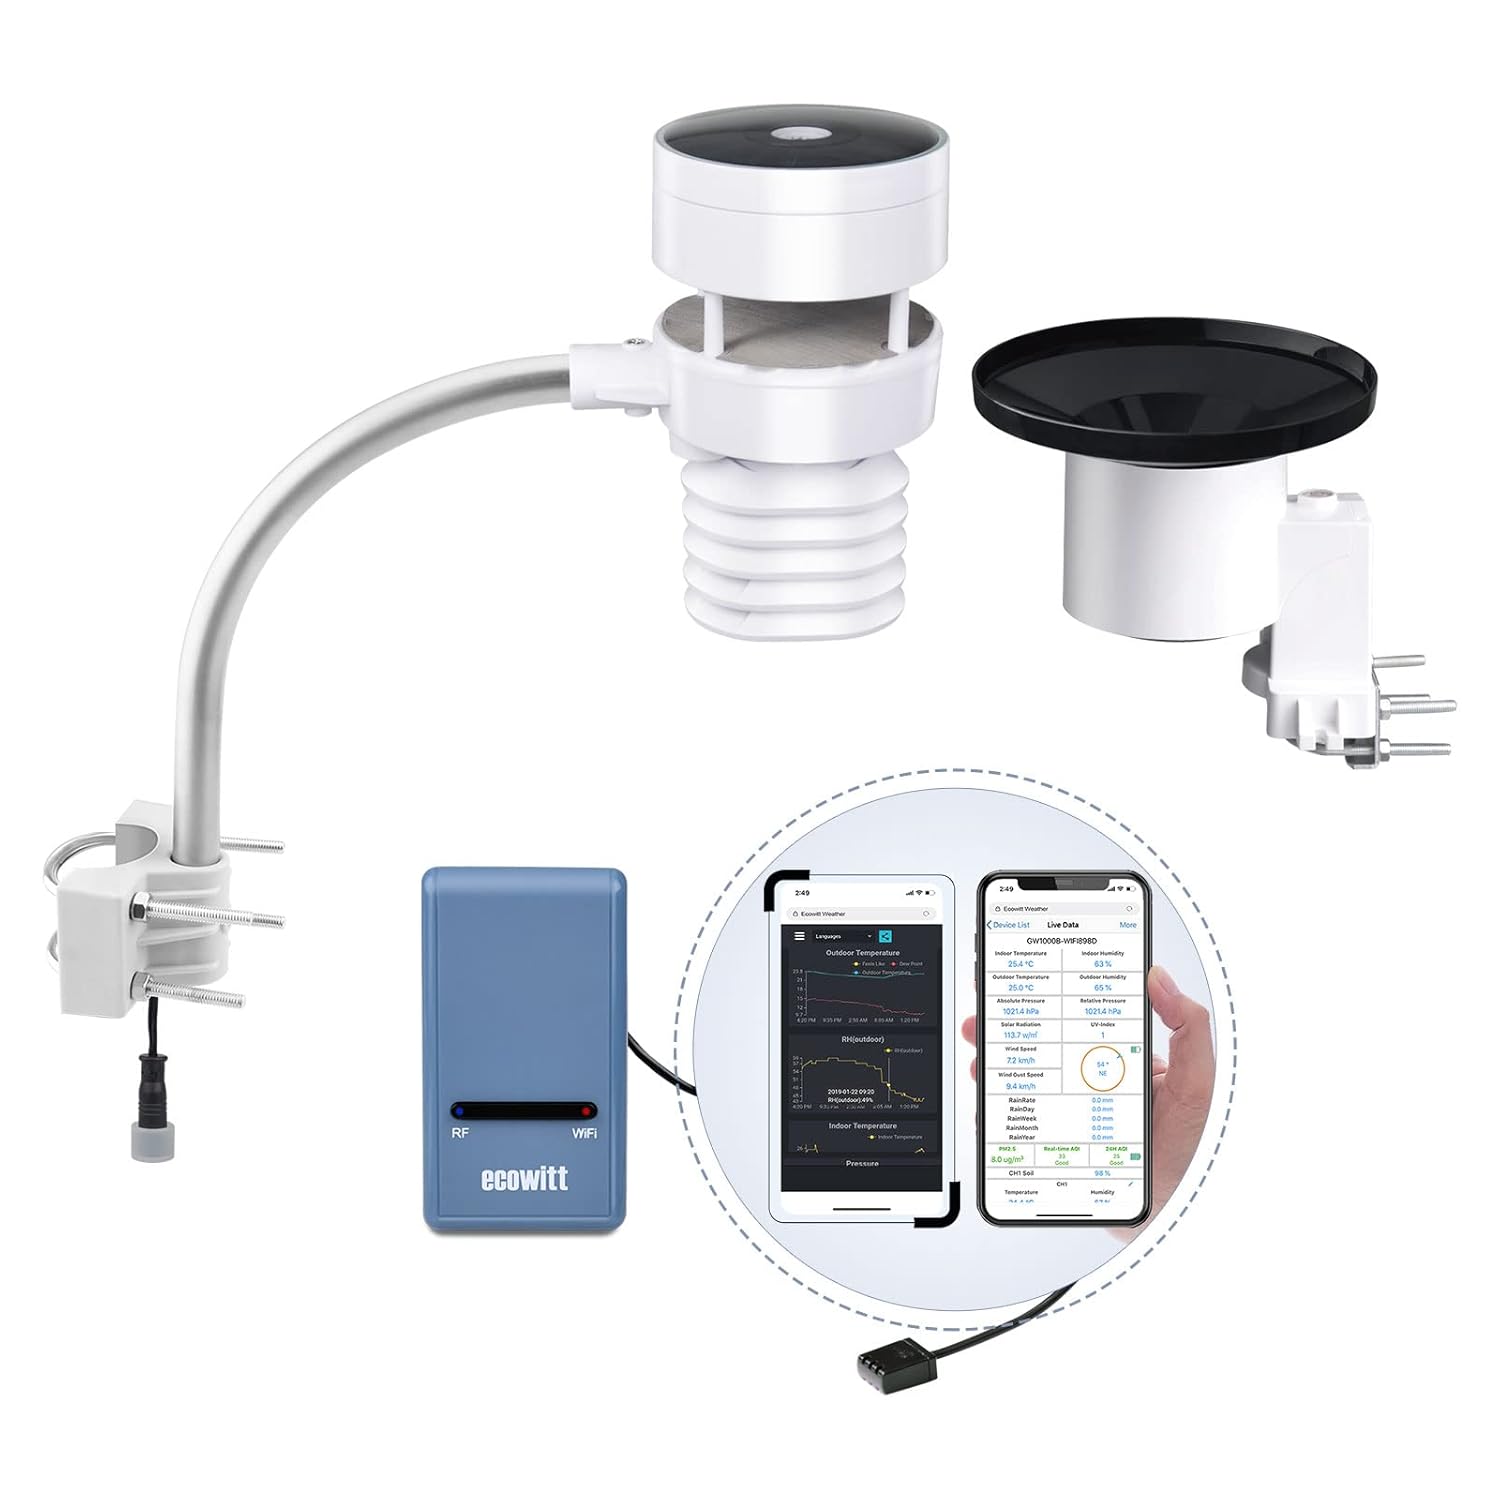
Eventually, I settled on one of the flavours of EcoWitt weather stations. Very deliberately, I went for one without the screen, as I thought the web interface would be enough to keep my need for data satiated, but that lasted right up until I realised this thing had a JSON output which I could poll.
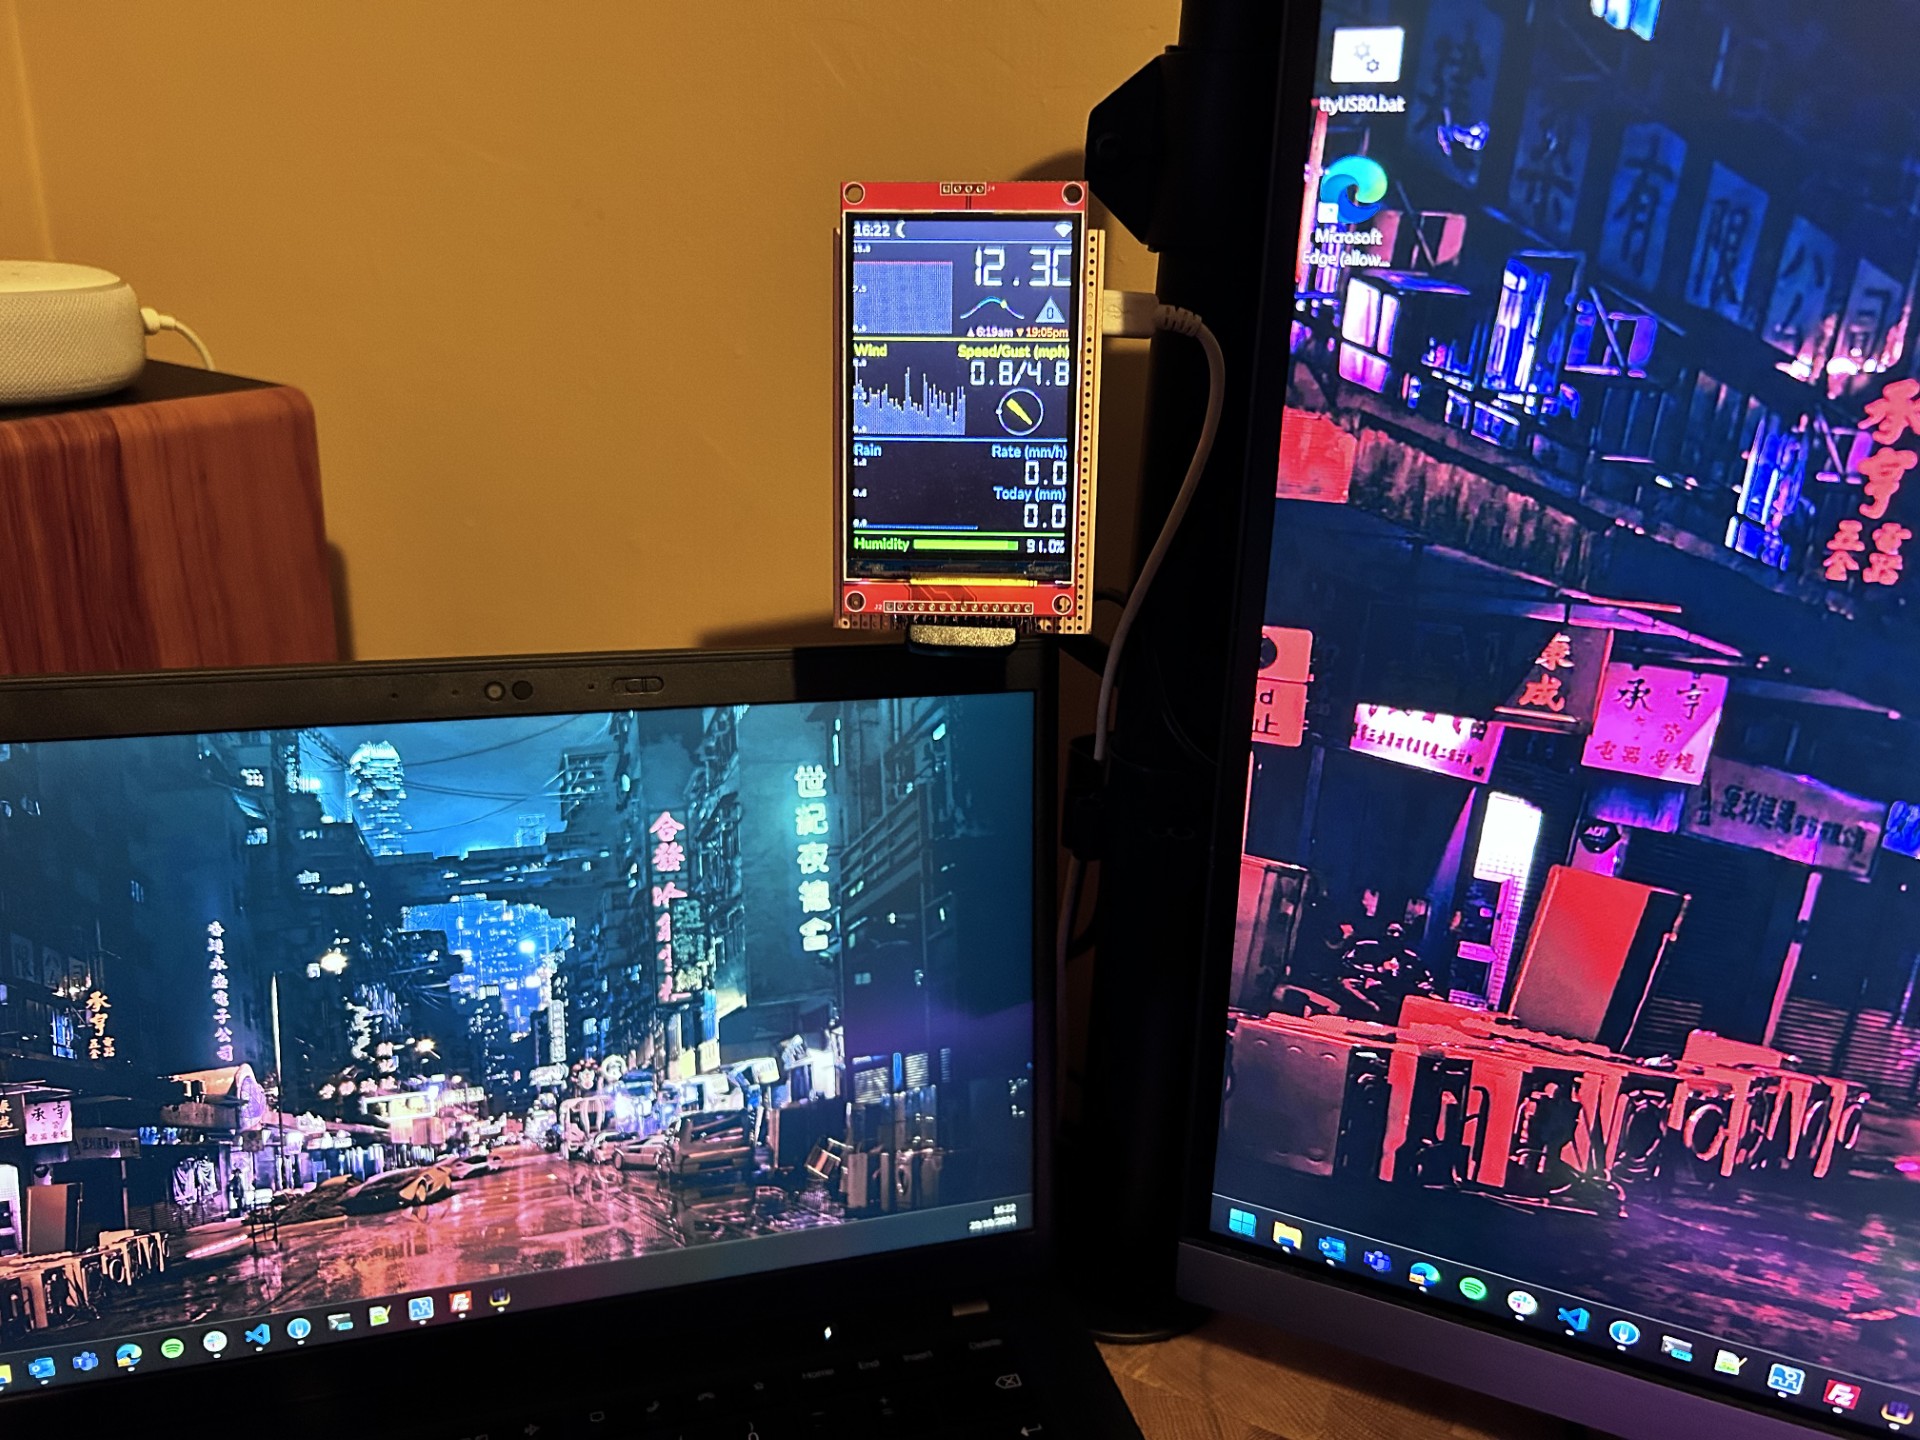
Using a bunch of bits from some old (read: abandoned) projects I had lying around, I was able to build a wee real-time display which sits amongst the rest of my screens at my desk.
Hardware
- Adafruit HUZZAH32
- Random 3.5" TFT from Amazon
- Some prototype board and 0.1" connectors I had in my box of bits
These wee screens are great, but it's a total crap-shoot as to what firmware they're running, so if you're following this guide, here be dragons 🐉. In the software, you’ll see a few kludges to get the colours I'm after on-screen. The device firmware I tell the TFT driver to use isn't actually the firmware advertised on the board, but after a lot of trial and error, this combination of settings got the thing working.
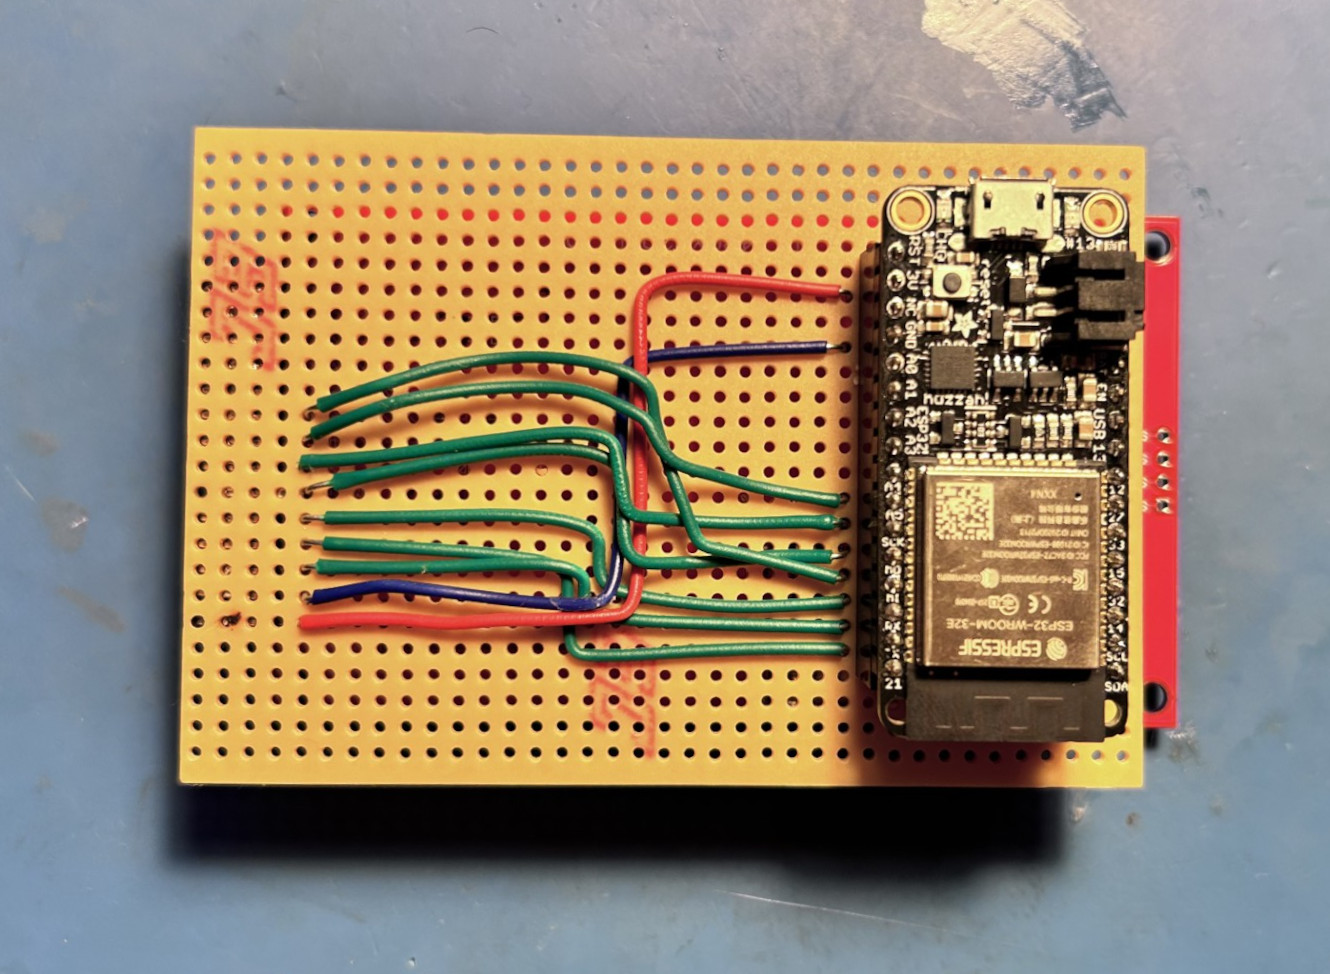
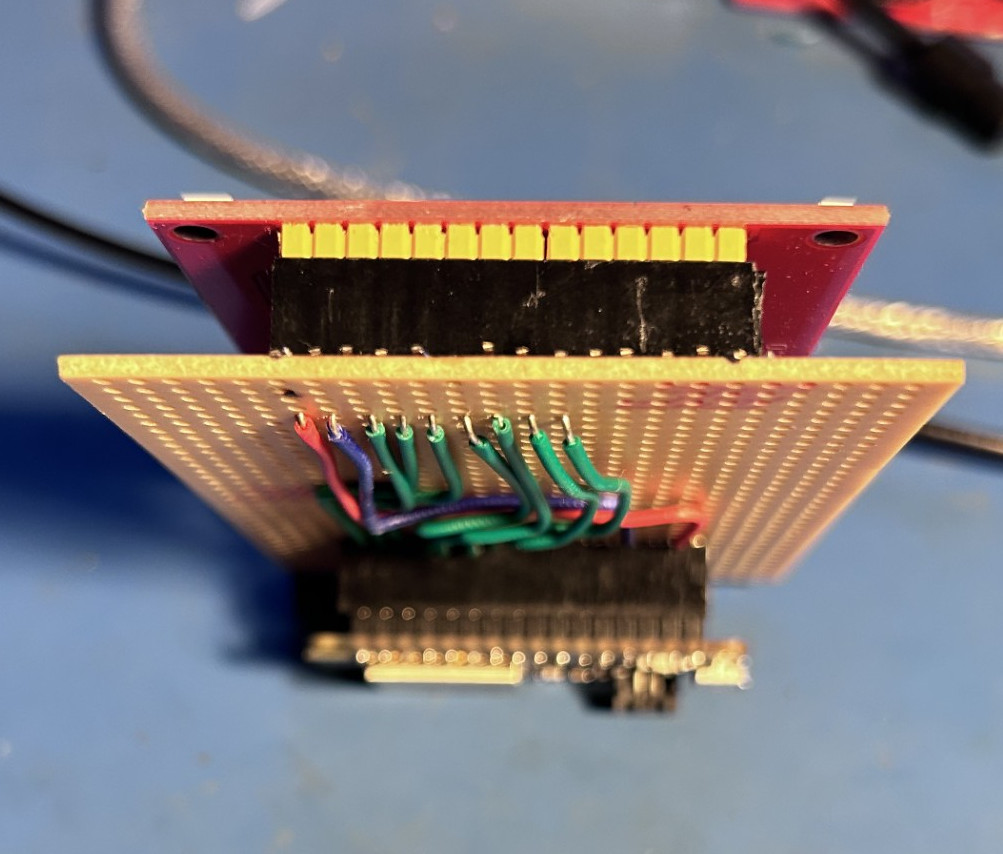
The Arduino has its SPI pins wired up to the SPI on the TFT, and that's about it as far as electrical work goes. This is my first time using a TFT display like this, and they are such a doddle to use I'm looking forward to integrating them into future projects.
Software
The fun bit. Here's the code on GitHub. It's a PlatformIO/VSCode project and is mostly C with a little sprinkle of C++ where it made sense.
When I started futzing with the Arduino, I discovered that under-the-hood, the thing is just running FreeRTOS, which is excellent as it gives me all the primitives I need to move data around the platform. I can break up each measurement I want to display as its own component which I can feed via message queues.
To manage the display, I used the phenomenal TFT-eSPI library by Bodmer. Normally I beg junior developers to never optimise their code early, but I learned whilst playing with this screen that if you want the display to update smoothly with lots of new data, you need to throw every trick at it:
- Only redraw the areas where pixels change
- Rely on sprites rather than drawing to the whole screen
- Reduce the colour depth to the absolute bare minimum for each sprite
void sun_widget_init() {

    /* Widgets */
    uv_sprite.createSprite(UV_SPRITE_WIDTH, UV_SPRITE_HEIGHT);
    uv_sprite.fillSprite(BGR(TFT_BACKGROUND));
    uv_sprite.setFreeFont(DIGITAL_FONT_SMALL);
    uv_sprite.setColorDepth(4);

    rise_set_sprite.createSprite(RISE_SET_SPRITE_WIDTH, RISE_SET_SPRITE_HEIGHT);
    rise_set_sprite.fillSprite(BGR(TFT_BACKGROUND));
    rise_set_sprite.setFreeFont(NORMAL_FONT_XSMALL);

    solar_cycle_sprite.createSprite(SOLAR_CYCLE_SPRITE_WIDTH, SOLAR_CYCLE_SPRITE_HEIGHT);
    solar_cycle_sprite.setColorDepth(4);
    solar_cycle_sprite.fillSprite(BGR(TFT_BACKGROUND));

    /* Sun rise/fall */
    sun.setPosition(LATITUDE, LONGITUDE, DST_OFFSET);

    sunQueue = xQueueCreate(3, sizeof(sun_packet));
    if (sunQueue == NULL) {
        log_e("No sunQueue created");
    }
    xTaskCreatePinnedToCore(
        sun_widget_task, "Sun Widget", SUN_WIDGET_STACK, NULL, SUN_WIDGET_PRIORITY, NULL, APP_CORE
    );
}
These EcoWitt stations serve up their real-time data at http://<ip_address>/get_livedata_info, and if you squint your eyes, it's pretty easy to figure out what all the values are:
{
  "common_list": [
    {
      "id": "0x02",
      "val": "10.0",
      "unit": "C"
    },
    {
      "id": "0x07",
      "val": "98%"
    },
    {
      "id": "3",
      "val": "10.0",
      "unit": "C"
    },
    {
      "id": "0x03",
      "val": "9.7",
      "unit": "C"
    },
    {
      "id": "0x0B",
      "val": "0.0 m/s"
    },
    {
      "id": "0x0C",
      "val": "0.7 m/s"
    },
    {
      "id": "0x19",
      "val": "3.4 m/s"
    },
    {
      "id": "0x15",
      "val": "3.39 W/m2"
    },
    {
      "id": "0x17",
      "val": "0"
    },
    {
      "id": "0x0A",
      "val": "89",
      "battery": "5"
    }
  ],
  "rain": [
    {
      "id": "0x0D",
      "val": "0.0 mm"
    },
    {
      "id": "0x0E",
      "val": "0.0 mm/Hr"
    },
    {
      "id": "0x10",
      "val": "0.0 mm"
    },
    {
      "id": "0x11",
      "val": "6.1 mm"
    },
    {
      "id": "0x12",
      "val": "76.0 mm"
    },
    {
      "id": "0x13",
      "val": "794.3 mm",
      "battery": "4"
    }
  ],
  "wh25": [
    {
      "intemp": "12.5",
      "unit": "C",
      "inhumi": "81%",
      "abs": "1021.0 hPa",
      "rel": "1021.0 hPa"
    }
  ]
}
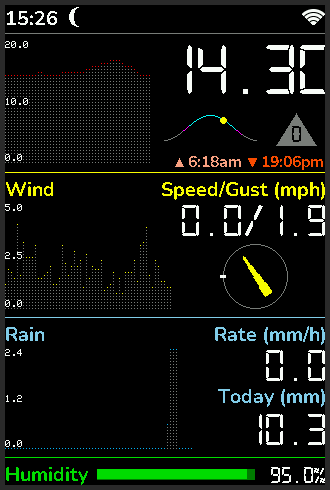
Putting all this together, I've created a little display that both renders data from the weather station and calculates some other nice-to-know details. In total, the thing shows me:
- Time
- Device and Wi-Fi status
- Moon phase
- Sunrise, sunset, and the sun's current position
- Wind speed, gust, and direction
- Temperature
- UV level
- Rain rate and total
- Humidity
- I could add pressure to this, but I'm not great at grokking millibars, and I've run out of screen space.
Here's the final output:
Final thoughts
It's pure windy outside my house. It's probably even windier if I move the weather station to a better spot. But that's a job for another project.
